Hello!
I am currently studying a course in statistical mathemathics at for a degree in engineering.
We have this project regarding a fictional scenario of air pollution.
The current assignment is to answer wether or not there is a way to modell the amount of days the pollution in the air exceeds two diffrent limits.
For this purpose we have two sets of data, one from 2008 and another from 2010. The Two limits are the longterm goal of 8.5ppm and the dangerous limit of 25 ppm.
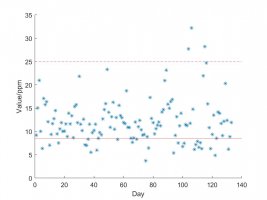
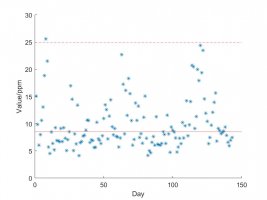
I plotted the dataseries in Matlab with the longterm goal as a full line and the dangerous limit as a dashed line.
For 2008:

[The data in pointform for 2008 with the day of measurement on the x-axis and the ppm on the y-axis]
For 2010:

[The data in pointform for 2010 with the day of measurement on the x-axis and the ppm on the y-axis]
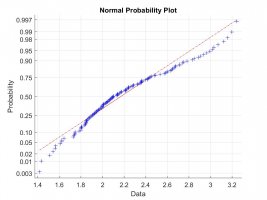
Using the normplot command in matlab I could see that the data was log-normal distributed.
Normplot for 2010:

[The data from 2010 log-normal distributed (the same applies for the 2008 dataseries)]
With all this in mind and the fact that the 2008 series has 133 points of data, and the 2010 series has 143 points I thought I might make use of the Central Limit Theorem.
I wrote some code in Matlab:
log2008=log(PM25_2008); %log of the 2008 data series
log2010=log(PM25_2010); %log of the 2010 data series
mulog2008=mean(log2008); %estimation of the expected value 2008
mulog2010=mean(log2010); %estimation of the expected value 2010
std2010=std(log2010); % estimation of the standard deviation 2008
std2008=std(log2008); % estimation of the standard deviation 2010
P852008 = 1-normcdf(log(8.5),mulog2008,std2008); % probability of exceeding log(8.5) in 2008
P252008 = 1-normcdf(log(25),mulog2008,std2008); % probability of exceeding log(25) in 2008
P852010 = 1-normcdf(log(8.5),mulog2010,std2010); % probability of exceeding log(8.5) in 2010
P252010 = 1-normcdf(log(25),mulog2010,std2010); % probability of exceeding log(25) in 2010
The last four lines of code, gave me a percentage of probability that comes pretty close to the fractional value of days actually exceeding the limits in the data.
My question is: Is this a valid way of modelling?
Our litterature is very vauge so I can't rely on litterature to much.
Thank you!
I am currently studying a course in statistical mathemathics at for a degree in engineering.
We have this project regarding a fictional scenario of air pollution.
The current assignment is to answer wether or not there is a way to modell the amount of days the pollution in the air exceeds two diffrent limits.
For this purpose we have two sets of data, one from 2008 and another from 2010. The Two limits are the longterm goal of 8.5ppm and the dangerous limit of 25 ppm.
I plotted the dataseries in Matlab with the longterm goal as a full line and the dangerous limit as a dashed line.
For 2008:

[The data in pointform for 2008 with the day of measurement on the x-axis and the ppm on the y-axis]
For 2010:

[The data in pointform for 2010 with the day of measurement on the x-axis and the ppm on the y-axis]
Using the normplot command in matlab I could see that the data was log-normal distributed.
Normplot for 2010:

[The data from 2010 log-normal distributed (the same applies for the 2008 dataseries)]
With all this in mind and the fact that the 2008 series has 133 points of data, and the 2010 series has 143 points I thought I might make use of the Central Limit Theorem.
I wrote some code in Matlab:
log2008=log(PM25_2008); %log of the 2008 data series
log2010=log(PM25_2010); %log of the 2010 data series
mulog2008=mean(log2008); %estimation of the expected value 2008
mulog2010=mean(log2010); %estimation of the expected value 2010
std2010=std(log2010); % estimation of the standard deviation 2008
std2008=std(log2008); % estimation of the standard deviation 2010
P852008 = 1-normcdf(log(8.5),mulog2008,std2008); % probability of exceeding log(8.5) in 2008
P252008 = 1-normcdf(log(25),mulog2008,std2008); % probability of exceeding log(25) in 2008
P852010 = 1-normcdf(log(8.5),mulog2010,std2010); % probability of exceeding log(8.5) in 2010
P252010 = 1-normcdf(log(25),mulog2010,std2010); % probability of exceeding log(25) in 2010
The last four lines of code, gave me a percentage of probability that comes pretty close to the fractional value of days actually exceeding the limits in the data.
My question is: Is this a valid way of modelling?
Our litterature is very vauge so I can't rely on litterature to much.
Thank you!
