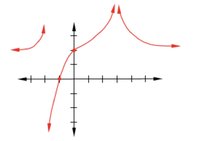
Hello. Is it possible for someone to help me with this graph?
The Question:
How would a function, f, be sketched according to the properties?
f(-1)=0, f(0)=2. f ‘(x) > 0 on (-∞, -2) ∪ (-2, 3), f ‘(x) < 0 on (3, ∞).
f “(x) > 0 on (-∞, -2) ∪ (0, 3) ∪ (3,∞), f “(x) < 0 on (-2, 0).
lim x→±∞ f(x) = 2, lim x→-2- f(x) = ∞, lim x→-2+ f(x) = -∞, lim x→3- f(x) = ∞, lim x→3+ f(x) = ∞.
My answer is attached below:

