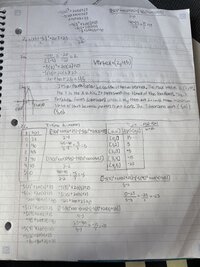
The homework question is: graph the average rates of change for h(t) and describe its shape?
my thoughts: I know the question is talking about the 2nd table avg values but I’m having trouble graphing it because there are more values of h(t) in the 1st table than the 2nd table. Do I put the avg values on the y axis or x axis?
The column on the right of the second table has two numbers but when I graph it on Desmos it doesn’t really work.
basically I’m confused how to graph this because I know one set of numbers to use but don’t know what others to use?