You are using an out of date browser. It may not display this or other websites correctly.
You should upgrade or use an alternative browser.
You should upgrade or use an alternative browser.
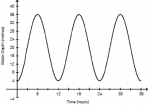
Determine an equation using a transformation of y =sinx that models depth in this bay
- Thread starter Bilal7
- Start date
- Joined
- Feb 4, 2004
- Messages
- 16,582
Where does the first cycle begin? Where does that first cycle end? This is the period.Determine an equation using a transformation of y =sinx that models depth in this bay...and the graph looks like this:
View attachment 4148
What is the least height? What is the greatest height? What is the difference between the greatest and least values? What is half of this difference? This is the amplitude.
What height is midway between the least and greatest heights? This is the center-line of the graph. How high is this above the x-axis? This is the vertical shift.
...and so forth. If you get stuck, please reply showing your work and reasoning, starting with your answers to the above questions. Thank you!
Where does the first cycle begin? Where does that first cycle end? This is the period.
What is the least height? What is the greatest height? What is the difference between the greatest and least values? What is half of this difference? This is the amplitude.
What height is midway between the least and greatest heights? This is the center-line of the graph. How high is this above the x-axis? This is the vertical shift.
...and so forth. If you get stuck, please reply showing your work and reasoning, starting with your answers to the above questions. Thank you!
So the period would be 12, 18 would be the amplitude and the midway height would be 20. Since the graph start 4 units above the x-axis, that would be the translation? So where do I plug in these values in order to create the equation? Thanks.
- Joined
- Feb 4, 2004
- Messages
- 16,582
Yes. The first period begins at "0" and ends at "12", so the period is 12 - 0 = 12 units.So the period would be 12
How did you obtain this value?18 would be the amplitude
Yes; the max is 36, the min is 4, so the "average" height is y = (36 + 4)/2 = 40/2 = 20.and the midway height would be 20.
No. Try using the steps and thinking listed earlier. In this case, where is the usual center line of a sine wave? Where is the center line of this sine wave? So what then must be the vertical shift?Since the graph start 4 units above the x-axis, that would be the translation?
What generic-form equation have they given you for trig functions and graphing? (Also, what have you noticed, based on the graphing you've studied and done yourself?)where do I plug in these values in order to create the equation?
Thank you!
D
Deleted member 4993
Guest
So this is what I got:
y = 16sin (π/6 x) + 20
Any errors?
According to your graph - at x = 0, y = ?
According to your equation - at x = 0, y = ?
Are those equal?
According to your graph - at x = 0, y = ?
According to your equation - at x = 0, y = ?
Are those equal?
In the graph, the y value is 4 when x is 0, but in my equation it is 20. Oops, where did I go wrong? :?
Should the c value be 4 then?
Last edited:
D
Deleted member 4993
Guest
In the graph, the y value is 4 when x is 0, but in my equation it is 20. Oops, where did I go wrong? :?
Should the c value be 4 then?
You have to shift x-axis now to match the given graph.
You mean the k value?You have to shift x-axis now to match the given graph.
D
Deleted member 4993
Guest
You mean the k value?
I don't know what does 'k' stand for!!
You have not shared the equation you are trying to use.
I don't know what does 'k' stand for!!
You have not shared the equation you are trying to use.
That would be y = asin(k(x-d)) + c

