Histogram Dilemma

CasIsBad@Math

New member
Joined
Feb 14, 2022
Messages
1
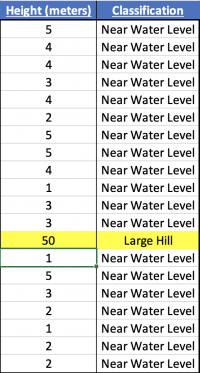
My homework question is: "A geographer randomly selects twenty points in a county to study the elevation. One point is on a large hill while the other points are near water level. What is the shape of the distribution?". I was simply told by my teacher that it's "skewed right".. but how do you know? I don't understand how the answer comes to this conclusion...
 
If your horizontal axis is measured in metres (or feet) above water level, and the vertical is frequency.
Can you try to draw a rough histogram where most points are represented down the low end and one point up the high end?
 
Consider this following dataset: Can you make a histogram with it?
Screen Shot 2022-02-14 at 9.58.00 PM.png
 

Attachments

  • Screen Shot 2022-02-14 at 9.57.09 PM.png
    Screen Shot 2022-02-14 at 9.57.09 PM.png
    114.5 KB · Views: 1
Instead of plotting 'x vs. y' try plotting 'log(x) vs. y' .

This transformation will reduce the 'visual ' impact of the outlier.

The height (or depth) is never negative - so the data are skewed to the right and not symmetric about the origin.
 
Last edited by a moderator:
Top