Scatter Plots and evaluating lines of fit for the data set

Reiko1113

New member
Joined
Apr 12, 2016
Messages
1
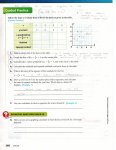
Hello, I'm in 8th grade Alg I advanced MYP/IB and I'm having trouble with scatter plots and how to fill out the table. Calculating the table is my first challenge. How do I do this properly? I'm not looking for you to do my homework just guide me to doing it right. I've attached a copy of the graph and the table along with the questions.
 

Attachments

  • Reiko Stat homework041216.jpg
    Reiko Stat homework041216.jpg
    498.7 KB · Views: 4
If you are referring to part (3) of the exercise, this is just asking you to plug the given x-values into the given equation, and simplify to find the corresponding y-values. For part (4), use whatever method they gave you in class for computing residuals; enter these values, along with their squares, into the table. For part (5), add up the squares you just found. For parts (6) and (7), I suspect that you're expected to follow what they showed in the referenced "Examples". ;)
 
Top