The graph of expression cos(a) + cos(b) = cos(a + b) show when the expression is valid.
The graph show an ellipses-like and not like a "perfect" ellipse.
If I want to change the expression, can I do it and get a perfect ellipse.
There is a way? Why? Or why not?
The graph:
http://www.wolframalpha.com/input/?i=plot:+cos(x)+cos(y)=cos(x+y),+-2pi+<+x+<+2pi,+-2pi+<+y+<+2pi
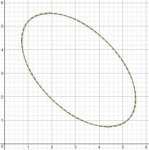
You're right that they look very close to ellipses, but probably are not exactly the same. I graphed an ellipse on top of your graph, and it differs slightly.
You could
replace your equation with the equation of a single rotated ellipse; would you call that "changing" it? Is there a reason you think you could make a (small?) change to the equation and produce an ellipse? The reason I don't expect to is that if two equations have different types of graphs, they are different types of equations! That would have to be a major change. So unless you are wrong about them not being ellipses, it's unlikely that a small change would make them ellipses.
Here is a picture of my ellipse, (x-y)^2+pi(x+y-2pi)^2=1.8 pi^2, the broken green line, superimposed on one loop of your figure, the solid red line:
View attachment 9987
I chose my parameters by eye (guessing at a nice center and eccentricity, then trying out various sizes), so it may be that it could be adjusted to match better, but mine is inside yours at some points, and outside it at others, in a way that two ellipses probably can't do. Maybe someone else can prove that (one part of) your equation is equivalent to something like mine, but I don't expect it.
Can you tell us anything about why you are asking?