You are using an out of date browser. It may not display this or other websites correctly.
You should upgrade or use an alternative browser.
You should upgrade or use an alternative browser.
The Central Limit Theorem
- Thread starter eutas1
- Start date
Harry_the_cat
Elite Member
- Joined
- Mar 16, 2016
- Messages
- 3,784
In (c) they are talking about the AVERAGE number of heads.
In (d) they are talking about the TOTAL number of heads.
In (d) they are talking about the TOTAL number of heads.
Ah, I see. So the population mean being equal to the sample mean only applies with the average, and if it is asking for the exact, you would multiply whatever value to the mean, etc?In (c) they are talking about the AVERAGE number of heads.
In (d) they are talking about the TOTAL number of heads.
Harry_the_cat
Elite Member
- Joined
- Mar 16, 2016
- Messages
- 3,784
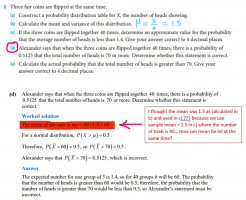
The mean of 1.5 is the expected number of heads you'll get when you flip three coins together. (I notice they say 1.4 in the last paragraph but this is an error.) How did you calculate the mean in the first place? Just checking that you did that correctly.
If you flip three coins together and do this 40 times, the TOTAL number of heads you should expect is 40x1.5=60.
If you flip three coins together and do this 40 times, the TOTAL number of heads you should expect is 40x1.5=60.
Ohhh I can now see that the 1.5 is the sample mean for flipping three coins (8.b), NOT the population mean...The mean of 1.5 is the expected number of heads you'll get when you flip three coins together. (I notice they say 1.4 in the last paragraph but this is an error.) How did you calculate the mean in the first place? Just checking that you did that correctly.
If you flip three coins together and do this 40 times, the TOTAL number of heads you should expect is 40x1.5=60.
For 8.c, you know it is a normal distribution because the sample size is larger than 30 - but this has nothing to do with the population mean whatsoever, which was one of my confusions. But then why do we use the same mean (1.5) for this n=40 sample? I thought the rule was that the POPULATION mean = sample mean, not sample mean = different sample mean... Or do all samples have the same mean? I'm confusing myself...
Also with the throwing 3 heads sample, how do we know its a normal distribution since the sample size is less than 30??
Harry_the_cat
Elite Member
- Joined
- Mar 16, 2016
- Messages
- 3,784
Did you do part (a)?
Harry_the_cat
Elite Member
- Joined
- Mar 16, 2016
- Messages
- 3,784
I'm asking that because I think it might make more sense if we go back to the beginning of the question.
Yeah I did (a), I didn't have any problems with doing that though.I'm asking that because I think it might make more sense if we go back to the beginning of the question.
Harry_the_cat
Elite Member
- Joined
- Mar 16, 2016
- Messages
- 3,784
Ok. So you can see from your probability distribution table, that it is NOT a normal distribution. In fact, it is a binomial distribution.
Harry_the_cat
Elite Member
- Joined
- Mar 16, 2016
- Messages
- 3,784
If X is the number of heads when you toss three coins. X can take the values 0, 1, 2, 3. Correct?
So your prob dist table looks like:
Correct?
So your prob dist table looks like:
| Number of heads (X) | 0 | 1 | 2 | 3 |
| P(X) | 1/8 | 3/8 | 3/8 | 1/8 |
Harry_the_cat
Elite Member
- Joined
- Mar 16, 2016
- Messages
- 3,784
What did you get for (b) the mean and variance of this distribution?
Harry_the_cat
Elite Member
- Joined
- Mar 16, 2016
- Messages
- 3,784
I'm happy to help you understand, but I need you to answer my questions.
Correct, I got that distribution table.What did you get for (b) the mean and variance of this distribution?
I got 3/2 or 1.5 for the mean, and 3/4 or 0.75 for the variance
Harry_the_cat
Elite Member
- Joined
- Mar 16, 2016
- Messages
- 3,784
Right great.
For the moment forget the words "population" and "sample". I think that is where you are getting confused.

Now, for (c) , you are flipping 3 coins 40 times. This will give you 40 data values for the number of heads for each "three coin flips". On the first go, you might get 2 heads, on the second go you might get 1 head, on the third go you might get 3 heads, etc,etc.
So you will end up with another distribution that might look like: 2, 1, 3, 3, 0, 1, 1, 1, 3, 2, 2, 0, 1, ..... where n=40.
Let's just say this list has a mean of 1.3.
If you do it again (ie toss 3 coins 40 times) you will end up with another list of 40 numbers, which might have a mean of 1.52.
These numbers 1.3, 1.52, etc etc will form a distributuion of sample means.
Because n>=30, this distribution will be approximately normally distributed with a mean of \(\displaystyle \mu\) and a variance of \(\displaystyle \frac{sigma^2}{n}\) .
So were you happy with the answer to (c)?
For the moment forget the words "population" and "sample". I think that is where you are getting confused.
Now, for (c) , you are flipping 3 coins 40 times. This will give you 40 data values for the number of heads for each "three coin flips". On the first go, you might get 2 heads, on the second go you might get 1 head, on the third go you might get 3 heads, etc,etc.
So you will end up with another distribution that might look like: 2, 1, 3, 3, 0, 1, 1, 1, 3, 2, 2, 0, 1, ..... where n=40.
Let's just say this list has a mean of 1.3.
If you do it again (ie toss 3 coins 40 times) you will end up with another list of 40 numbers, which might have a mean of 1.52.
These numbers 1.3, 1.52, etc etc will form a distributuion of sample means.
Because n>=30, this distribution will be approximately normally distributed with a mean of \(\displaystyle \mu\) and a variance of \(\displaystyle \frac{sigma^2}{n}\) .
So were you happy with the answer to (c)?
Wait........ that's confusing... isn't it one sample though that they give you?? Am I evaluating that one sample or am I considering that to be part of a distribution of sample means??? I'm sorry I don't even know what I don't understand about that. It's not clicking for me just yet.Right great.
For the moment forget the words "population" and "sample". I think that is where you are getting confused.
View attachment 28556
Now, for (c) , you are flipping 3 coins 40 times. This will give you 40 data values for the number of heads for each "three coin flips". On the first go, you might get 2 heads, on the second go you might get 1 head, on the third go you might get 3 heads, etc,etc.
So you will end up with another distribution that might look like: 2, 1, 3, 3, 0, 1, 1, 1, 3, 2, 2, 0, 1, ..... where n=40.
Let's just say this list has a mean of 1.3.
If you do it again (ie toss 3 coins 40 times) you will end up with another list of 40 numbers, which might have a mean of 1.52.
These numbers 1.3, 1.52, etc etc will form a distributuion of sample means.
Because n>=30, this distribution will be approximately normally distributed with a mean of \(\displaystyle \mu\) and a variance of \(\displaystyle \frac{sigma^2}{n}\) .
So were you happy with the answer to (c)?
With (c), I think I do get it now. Initially, I did not understand how to do it because I didn't know the X values could be averages?? I also though the lower bound was 10^-99 and then realised it was 0 because we are working with the means and 0 is the smallest you can get?
Wait I think I get everything now. It's slowly like coming together in my head. I think the biggest issue was realising the difference between the average and total questions. and also realising that (a) and (c) are the same distribution as in both flipping 3 coinsWait........ that's confusing... isn't it one sample though that they give you?? Am I evaluating that one sample or am I considering that to be part of a distribution of sample means??? I'm sorry I don't even know what I don't understand about that. It's not clicking for me just yet.
With (c), I think I do get it now. Initially, I did not understand how to do it because I didn't know the X values could be averages?? I also though the lower bound was 10^-99 and then realised it was 0 because we are working with the means and 0 is the smallest you can get?
Harry_the_cat
Elite Member
- Joined
- Mar 16, 2016
- Messages
- 3,784
Yes you are only taking one sample of 40 and calculating its mean. But that mean is part of a distribution of sample means and that distribution of sample means has a mean of mu and a variance of sigma^2/n. You need to know what sort of distribution that one sample mean comes from to work out the probability needed.Wait........ that's confusing... isn't it one sample though that they give you?? Am I evaluating that one sample or am I considering that to be part of a distribution of sample means??? I'm sorry I don't even know what I don't understand about that. It's not clicking for me just yet.
With (c), I think I do get it now. Initially, I did not understand how to do it because I didn't know the X values could be averages?? I also though the lower bound was 10^-99 and then realised it was 0 because we are working with the means and 0 is the smallest you can get?
Attachments
Harry_the_cat
Elite Member
- Joined
- Mar 16, 2016
- Messages
- 3,784
(a) and (c) are not the same distributionWait I think I get everything now. It's slowly like coming together in my head. I think the biggest issue was realising the difference between the average and total questions. and also realising that (a) and (c) are the same distribution as in both flipping 3 coins
In (a) the distribution will look like: 0, 3, 2, 2, 1, 2, 3, 0, 0, 2, 2, 2, 1, ... which has a mean of 1.5 and a variance of 0.75.
In (c), the distribution will look like: 1.4, 1.52, 1.3, 1.53. 1.38, 1.45, ....which are the means of each of the (a)-type lists. This distribution has a mean of mu=1.5 (the same as (a), but the variance is sigm^2/n = 0.75/40 = 0.01875.
Compare the list of numbers in (a) and (c) in the paragraph above. Can you see that the means will be the same, but the data in (c) are more packed together, hence have a smaller variance.
Ahhhh yes yes I think I get it now.Yes you are only taking one sample of 40 and calculating its mean. But that mean is part of a distribution of sample means and that distribution of sample means has a mean of mu and a variance of sigma^2/n. You need to know what sort of distribution that one sample mean comes from to work out the probability needed.
I shouldn't have used 'distribution' - i meant that they both are flipping 3 coins so its the same action but just doing it 40 times rather than 3. I think I forgot that they were the same action which is why I didn't know why the means were the same.(a) and (c) are not the same distribution
In (a) the distribution will look like: 0, 3, 2, 2, 1, 2, 3, 0, 0, 2, 2, 2, 1, ... which has a mean of 1.5 and a variance of 0.75.
In (c), the distribution will look like: 1.4, 1.52, 1.3, 1.53. 1.38, 1.45, ....which are the means of each of the (a)-type lists. This distribution has a mean of mu=1.5 (the same as (a), but the variance is sigm^2/n = 0.75/40 = 0.01875.
Compare the list of numbers in (a) and (c) in the paragraph above. Can you see that the means will be the same, but the data in (c) are more packed together, hence have a smaller variance.