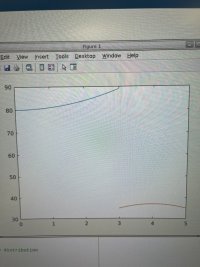
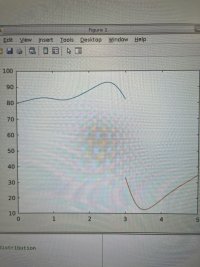
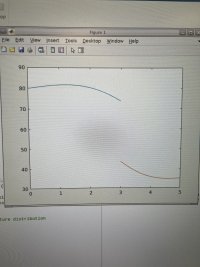
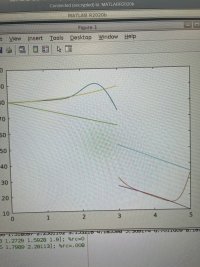
lambda1=.0383
lambda2=.1884
lambda3=.4833
I checked your equation. If I use it, I get:
\(\displaystyle \lambda_1 = 0.359\)
\(\displaystyle \lambda_2 = 0.433\)
\(\displaystyle \lambda_3 = 0.686\)
I have seen you doing pretty well in finding the steady state and the transient solutions, so I will trust in you and your other calculations!
I expect the transient curve to be lower than the initial curve for all values of t>0. The left material should be cooling when in contact with the right material which is warming.
Are you an expert in curves or what? If you are, then you should already know the following:
One of these can cause a bump in the graph.
Material property mismatch:
If thermal conductivities \(\displaystyle k_1 \neq k_2\), the rate at which heat spreads in each region differs. A bump can form temporarily in the region with slower diffusion (often the less conductive material).
Contact resistance:
If there's resistance to heat flow at the interface (modelled as a discontinuity in flux or temperature), heat might "pile up" on one side (often the higher-resistance side), creating a transient local maximum.
Initial conditions:
The initial temperature distribution or mismatch in temperatures between regions can set up a scenario where a temporary bump forms and then smooths out as time progresses.
Mathematical solution behavior:
Solutions to parabolic PDEs like the heat equation can have non-monotonic transient states, especially near boundaries or interfaces with discontinuous conditions.
There are also many other factors that can cause that rise in the curve. I am as an expert in ODEs and PDEs for more than \(\displaystyle 5\) years, I expect a temporary rise (bump) develops but gradually levels out over time.
Therefore, it is very normal to see a bump, even though it may seem counterintuitive at first.


