Determining function based on the graph

Engineer2021

New member
Joined
Jun 8, 2021
Messages
3
Hi guys,

This is my first post here, hello everybody ?
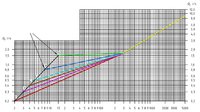
I hope you can help me with the math problem I have. I am trying to determine a function based on the graph I have (see attached). Each color represents one function. starting/ending points are no concern because I will set a limit based on X values.
Can anyone solve this?
 

Attachments

  • 2021-06-06 18_36_40-Window.jpg
    2021-06-06 18_36_40-Window.jpg
    691.5 KB · Views: 10
Look up how to derive an equation of a line based on 2 points.
 
If you look at the graph you will see this is logarithmic / exponential function, it's not simple as that

Actually, it is (almost) that simple. Since this is a log-log plot, the straight line relates log(x) and log(y). So find an equation of that line.

Or, recognize that since the equation has the form log(y) = a log(x) + b, it can be written as y = Bx^A. Your two points will yield two equations in A and B, which you can solve for the parameters.

Look up log-log plots. E.g. https://en.wikipedia.org/wiki/Log–log_plot
Thanks for the reply dr. I have managed to find the function, thanks! :D not 100% but I will play with the constants a bit
 
Top